LinkedIn newsletter analytics is a powerful tool that can help you understand how your newsletter is performing and where you can make improvements.
By understanding your newsletter analytics, you can make changes to improve your open rates, click-through rates, and unsubscribe rates.
You can also use LinkedIn newsletter analytics to understand which articles are shared and generate the most engagement.
In this article, we’ll look at how to use LinkedIn analytics to improve your newsletter and how you can bank on this powerful feature and deliver the spot-on content your target audience would crave.
What is LinkedIn Newsletter Analytics?
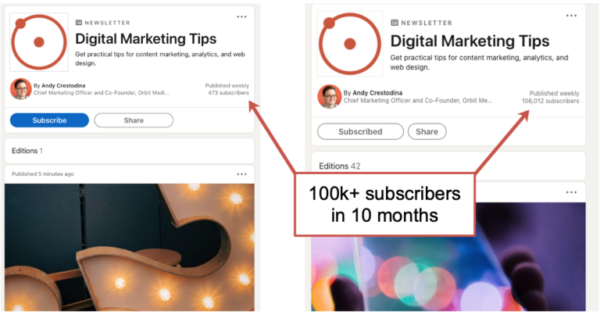
LinkedIn Newsletter Analytics is a tool that allows you to see how your newsletter is performing. You can see how many people are opening it, how many are clicking on links, and how many are unsubscribing.
For account-based marketing, banking on data analytics can save your marketing team from aimless delivery of marketing campaigns as it helps them come up with a realistic diagnosis of their marketing efforts and their audience’s behavior.
It can help you understand what people are interested in and what they’re not so that you can adjust your newsletter accordingly.
Benefits of LinkedIn Newsletter Analytics
LinkedIn Newsletter Analytics help marketers with various parts of delivering an impeccable influence to their target audience. It is a friend for companies that emphasize customer satisfaction and better engagement. Here are some of the power it holds:
- Data-driven diagnosis of audience behavior
- Better insights on audience interest and pain points
- Superior tool for marketing strategy alignment
- Geographical distribution of content
Data-Driven Diagnosis of Audience Behavior
LinkedIn Newsletter Analytics can provide a data-driven diagnosis of audience behavior in several ways.
First, it can track how readers interact with each newsletter, including how long they spend reading it, what sections they read, and what links they click.
This data can assess which topics are most engaging for readers and whether the newsletter successfully drives traffic to other parts of the LinkedIn platform.
Additionally, it can track how readers subscribe to and unsubscribe from newsletters, providing insights into overall engagement levels.
Finally, the platform can also provide detailed information on individual reader behavior, which is used to identify potential improvement areas.
Better Insights on Audience Interests and Pain Points
LinkedIn Newsletter Analytics can help marketing teams to gain better insights into audience interests and pain points. By tracking how often users interact with each newsletter, what type of content they engage with, and which links they click on, LinkedIn can provide valuable data that can help marketers to improve their newsletter strategy.
For example, suppose a marketing team notices that users consistently click on links related to a specific topic. In that case, they can infer that this is a pain point or interest for their audience and adjust their content strategy accordingly.
In addition, by understanding which topics are shared the most, marketers can create more targeted content that is more likely to interest their audience.
LinkedIn Newsletter Analytics can help marketing teams better understand their audience and create stronger relationships.
Geographical Distribution of Content
LinkedIn Newsletter Analytics can identify the geographical distribution of their marketing campaigns by analyzing the data from engagement with the newsletter.
This data can include the location of the users who open the newsletter, the user’s location, and so on.
By analyzing this data, LinkedIn can see which areas are most engaged with their newsletter and tailor their marketing campaigns accordingly.
Superior Tool for Marketing Strategy Alignment
LinkedIn Newsletter Analytics can help B2B companies in some ways when it comes to aligning their marketing strategy.
One of the most important ways is by providing data that can help identify which marketing strategies are most effective and which need to be tweaked or changed.
This data can help show what is working and what isn’t, saving time and money in the long run. Another way LinkedIn Newsletter Analytics can help is by providing insight into what your target audience is interested in.
It can help you fine-tune your marketing strategy to ensure you’re putting your best foot forward. If you know what your target audience wants, you can ensure you’re giving them content they’re interested in.
Important Metrics in LinkedIn Newsletter Analytics
When looking at the statistics of your marketing campaigns, there are essential metrics monitored by the industry. These help your team understand what’s happening in your marketing campaigns, solve problems and influence better responses in the future.
Open Rate
Open rate is a measure of how often recipients open an email. It is expressed as a percentage and is calculated by dividing the number of opened emails by the number of delivered emails.
For example, if an email is sent to 100 people and 50 open it, the available rate would be 50%.
Open rate is a valuable metric for email marketers because they can use it to gauge the effectiveness of an email campaign.
If the open rate is low, it may indicate that the email content is not interesting or relevant to the recipients. Conversely, a high available rate may tell that the email campaign is catchy enough the grab their attention.
It is a good start for marketers who beat the dreaded feeling of not being noticed.
Subscription Rate
The Subscription Rate in newsletter analytics is the percentage of people who subscribe to a newsletter after viewing it. It is an important metric because it helps determine a newsletter’s effectiveness in terms of its ability to engage and interest its audience.
To calculate the subscription rate, divide the number of people who subscribe by the number of people who started the free trial.
For example, if 100 people start a free trial and ten subscribe, the subscription rate would be 10%.
The subscription rate can be affected by several factors, including the content’s quality, the design of the newsletter, and the overall tone and approach of the publication.
Unsubscribe Rate
When looking at newsletter analytics, one of the key metrics to pay attention to is the unsubscribe rate. This rate indicates how well the newsletter is performing and how engaged subscribers are with the content.
The unsubscribe rate can be a good indicator of the health of your email list -A high unsubscribe rate could indicate that the content is not relevant to the subscribers or is not well-written.
It could also be a sign that the frequency of the newsletter is too high and that subscribers are getting tired of receiving it.
On the other hand, a low unsubscribe rate is a good sign that the newsletter is performing well and that engaged subscribers are with the content.
It could also signify that the frequency is just right and that subscribers look forward to receiving it.
There are a few different ways to compute the unsubscribe rate, but the most common method is to take the number of unsubscribes and divide it by the number of total subscribers.
So, if you have 100 subscribers and 10 of them unsubscribe, your unsubscribe rate would be 10%. It’s important to note that the unsubscribe rate can vary depending on the industry, so it’s always best to compare your unsubscribe rate to others in your same industry.
Click-through Rate
The click-through rate in newsletter analytics is a metric that measures how many people who receive a newsletter click on at least one link within the newsletter.
This metric is an excellent way to measure your newsletter subscribers’ engagement and see how effectively your newsletter content drives clicks to your website or blog.
CTR provides valuable insights into how effectively a newsletter drives traffic to a website or landing page.
A high CTR indicates that recipients are interested in the newsletter’s content and are clicking to learn more. A low CTR may suggest that the content is irrelevant to the audience or that the newsletter is not well-designed.
There are a few different ways to compute click-through rates in newsletter analytics.
One method is to take the number of times a link in the newsletter was clicked and divide it by the number of times it was opened. It can be valuable to track how often readers click on your newsletter links.
Another way to compute the click-through rate is to take the number of clicks on a link divided by the number of people who received the newsletter.
Read Rate
The read rate in terms of newsletter analytics is a measure of how many people open and read a given newsletter. This metric is important because it allows businesses to gauge their newsletters’ effectiveness in engaging their audience.
A high read rate indicates that people are interested in the newsletter’s content and are more likely to act on it. In contrast, a low read rate demonstrates that the newsletter is ineffective in engaging its audience.
One way is to make the text more exciting and engaging for the reader. It is done by using more descriptive and vivid language and structuring the text in an engaging and easy-to-follow way.
Another way to improve the read rate is to make the text shorter and easier to read. It is done by using more straightforward language and sentence structure and breaking the text into shorter paragraphs.
By now, we hope this article has helped you understand how your newsletter is performing and where you can make improvements to deliver the spot-on content your target audience would crave.
Let us know your thoughts in the comments section below.

